So as not to be one of those recipe web sites where all you want is the recipe, the code for this sample project is here.
I have a few app projects that make use of maps to convey location information. I prefer to work in SwiftUI when possible and this sometimes requires setting lower expectations of what you can achieve. While MapKit was recently improved for SwiftUI use, it still lacks features that are present in UIKit/AppKit. One of those missing features is support for “clustering” markers on the map. Clustering is when a group of map markers are joined into one where their display would otherwise overlap.
In older, pre-SwiftUI, frameworks Apple provides robust support for clustering markers with just a few lines of code. Alas with SwiftUI, we don’t have that luxury and with the yearly release cycles we are unlikely to have this ability show up any time soon.
I wanted to see if it was possible to do this myself so I did some research into how clustering is typically done. I came across many articles describing various methods and algorithms used to implement clustering and calculating the distance between map coordinates on the screen. You need both of these pieces to implement any solution. It’s not enough to say this two locations are 100 meters apart so their markers should be clustered. 100 meters means different things at different map scales. You would also like this clustering to happen any time the map is redrawn so it needs to be fast.
There seems to be consensus around using the DBSCAN algorithm to create clusters of locations on a map. I try to avoid math in order to avoid headaches but the basic concepts of the article linked above make sense and are worth browsing. An implementation of the DBSCAN algorithm will take a group of items with coordinates, a distance to check for separation and a function to be used to determine the actual distance between any of those items.
There are a few DBSCAN implementations available for Swift and I picked one and added it to my projects. A version is included in the repo for this sample project. I don’t recall where I found this implementation but I am certain it was free to use/distribute. If you are or know the author let me know and I’ll give credit.
Give the DBSCAN algorithm we only need our location items and that distance function to determine how far apart any markers would be rendered on the map view. More research reveals that it’s nice to be able to use your GPU to quickly process a bulk of point data to determine these distances. As luck would have it Apple has created a Single Instruction, Multiple Data (SIMD) library that contains methods to do this distance calculation very quickly. If you want to read more about SIMD head on over to Wikipedia. All that you need to know to make use of Apples code is to import simd into your project and call it accordingly.
Now we get to the actual recipe of how to make use of all this math.
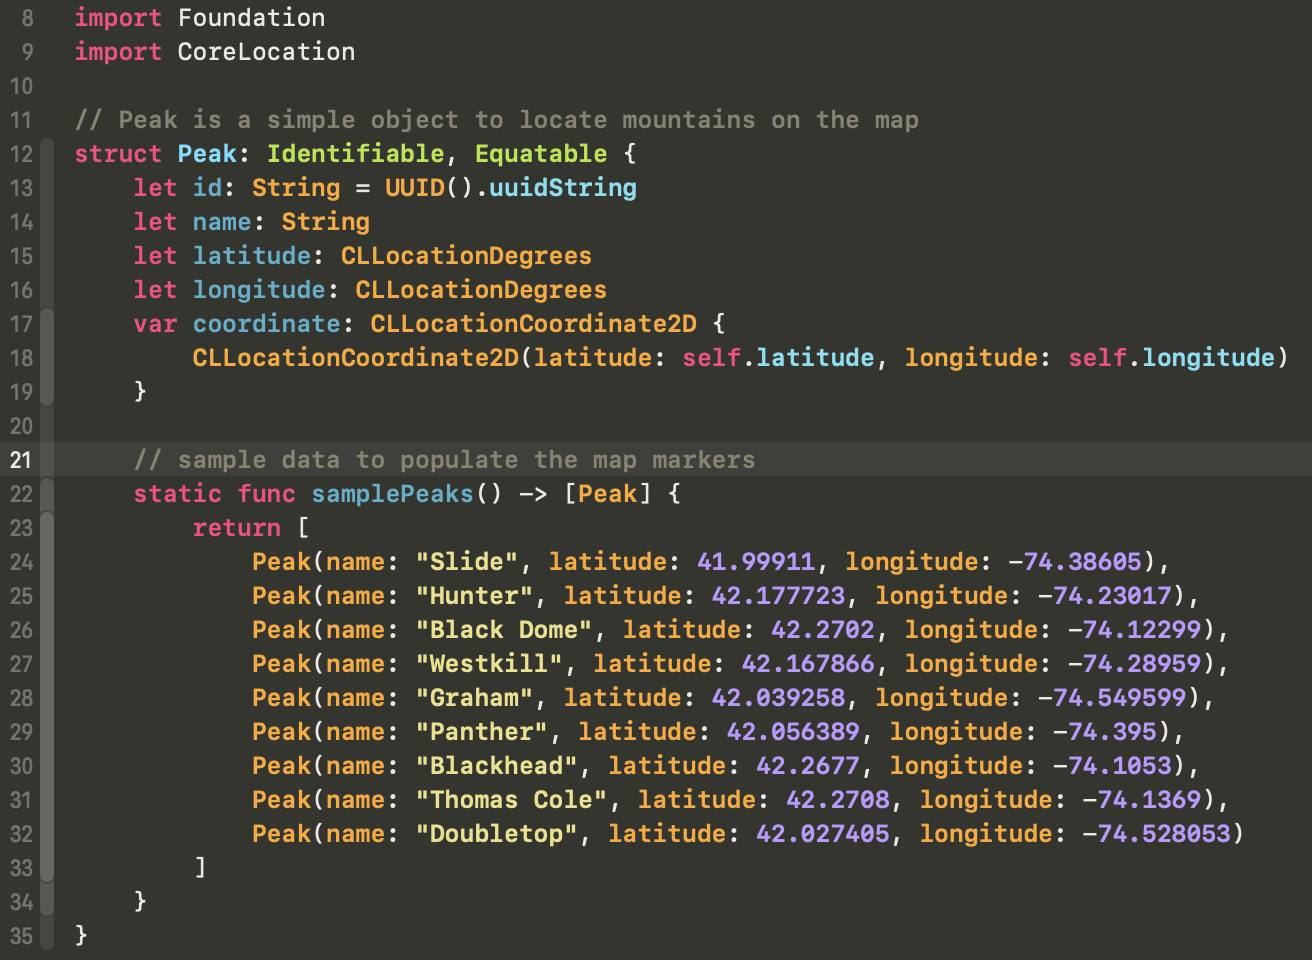
For this sample project we will render a few peaks in the Catskill mountains. We also provide a static function to give us a few peaks.

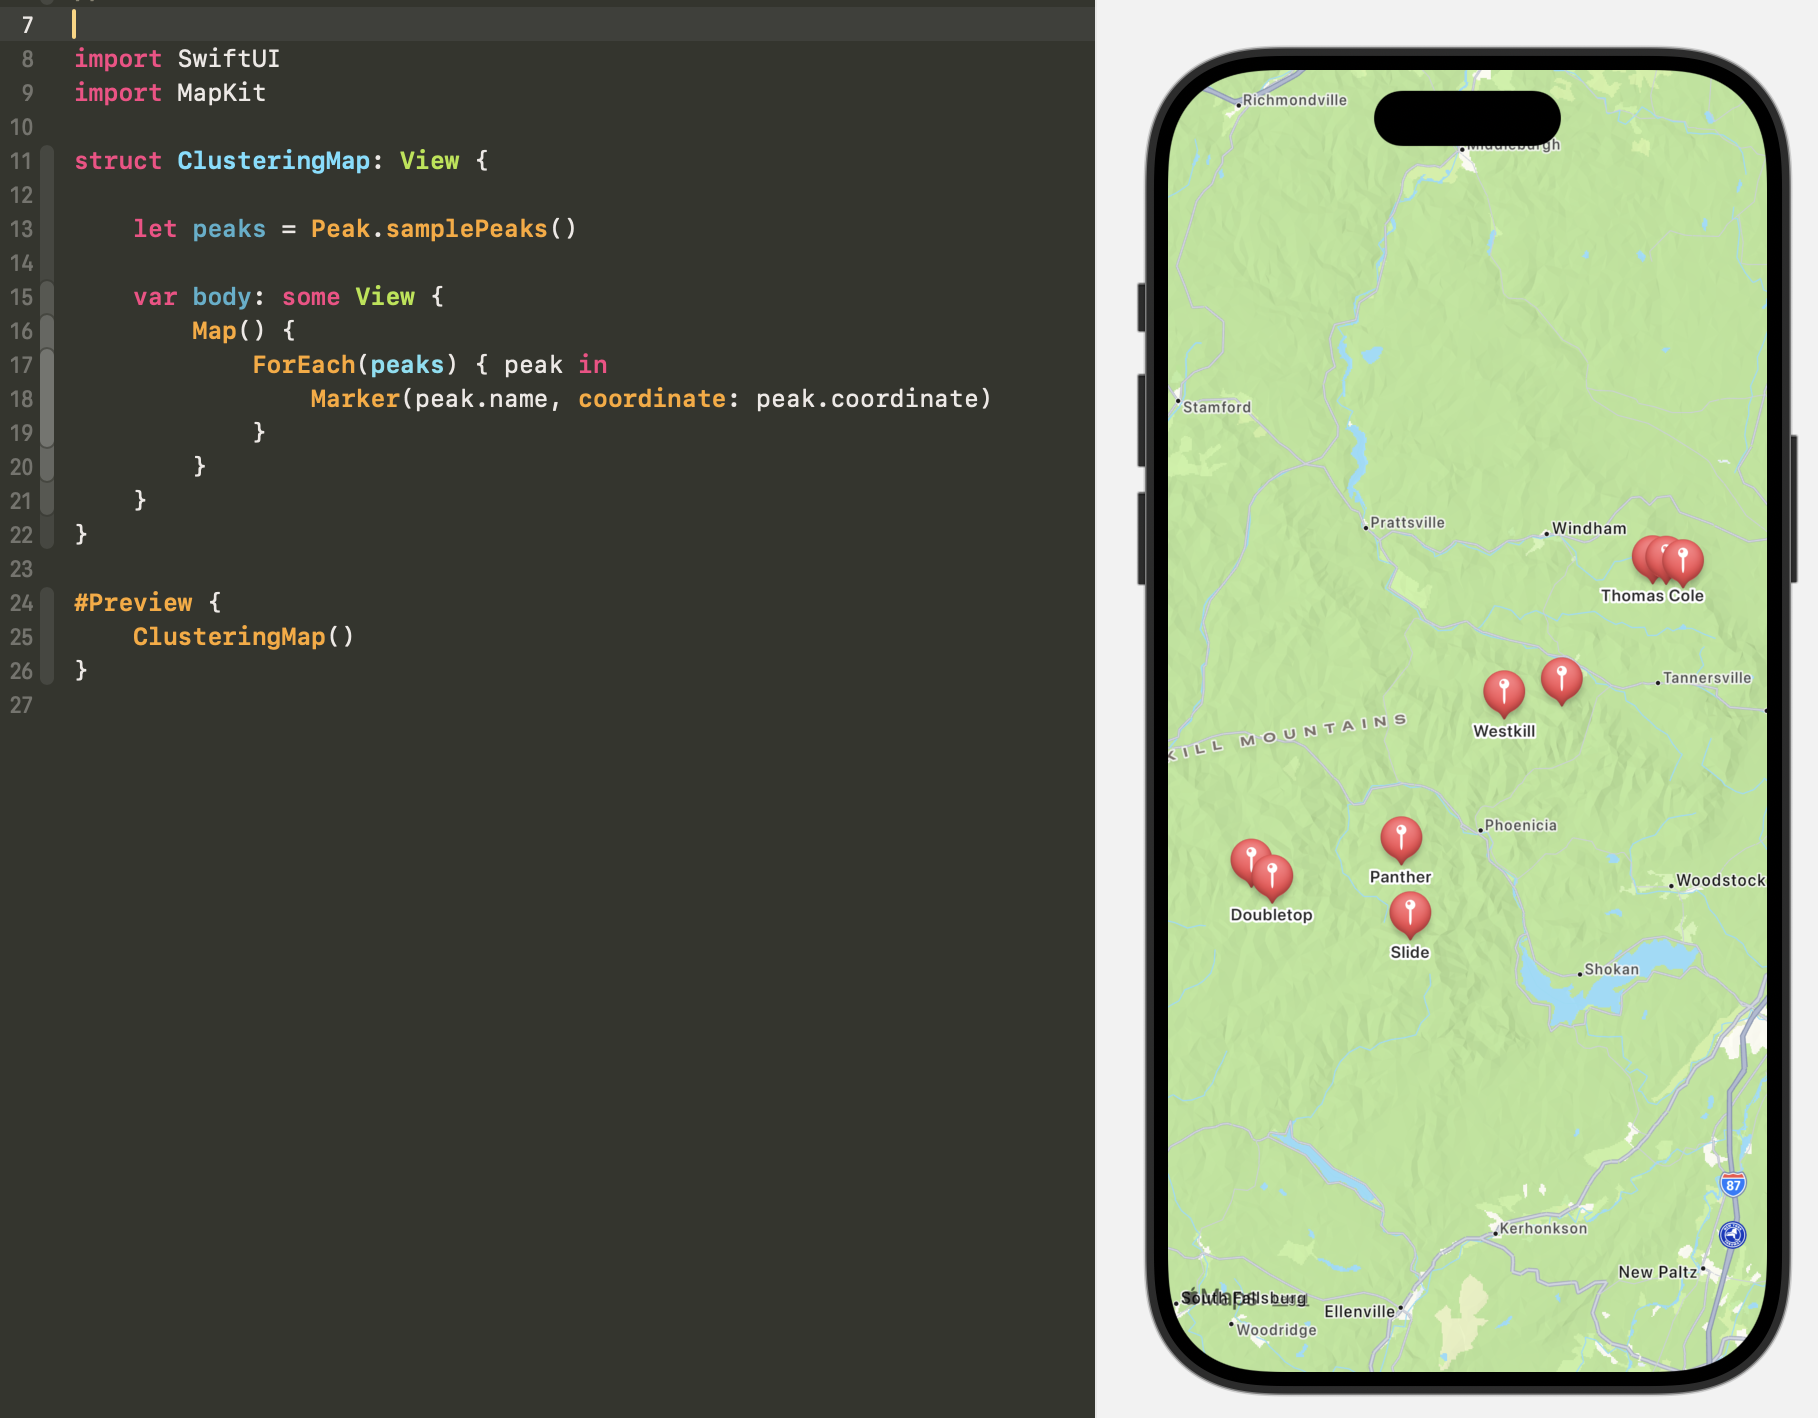
You can easily render those sample peaks on a map in SwiftUI by iterating over the samplePeaks array and creating a Marker for each one. Doing so would show the overlapping problem we hope to clear up by implementing clustering. Notice in the upper right and lower left of the map a few peaks overlap.

So we need to render something other than these individual peaks. What we will render is a marker for an array of peaks. That array may contain only one peak when there is no overlap but in instances where peak markers would overlap the array will contain more than one peak rendered as a single marker. Here is a simple implementation of a PeakCluster item that can be used to create these arrays.

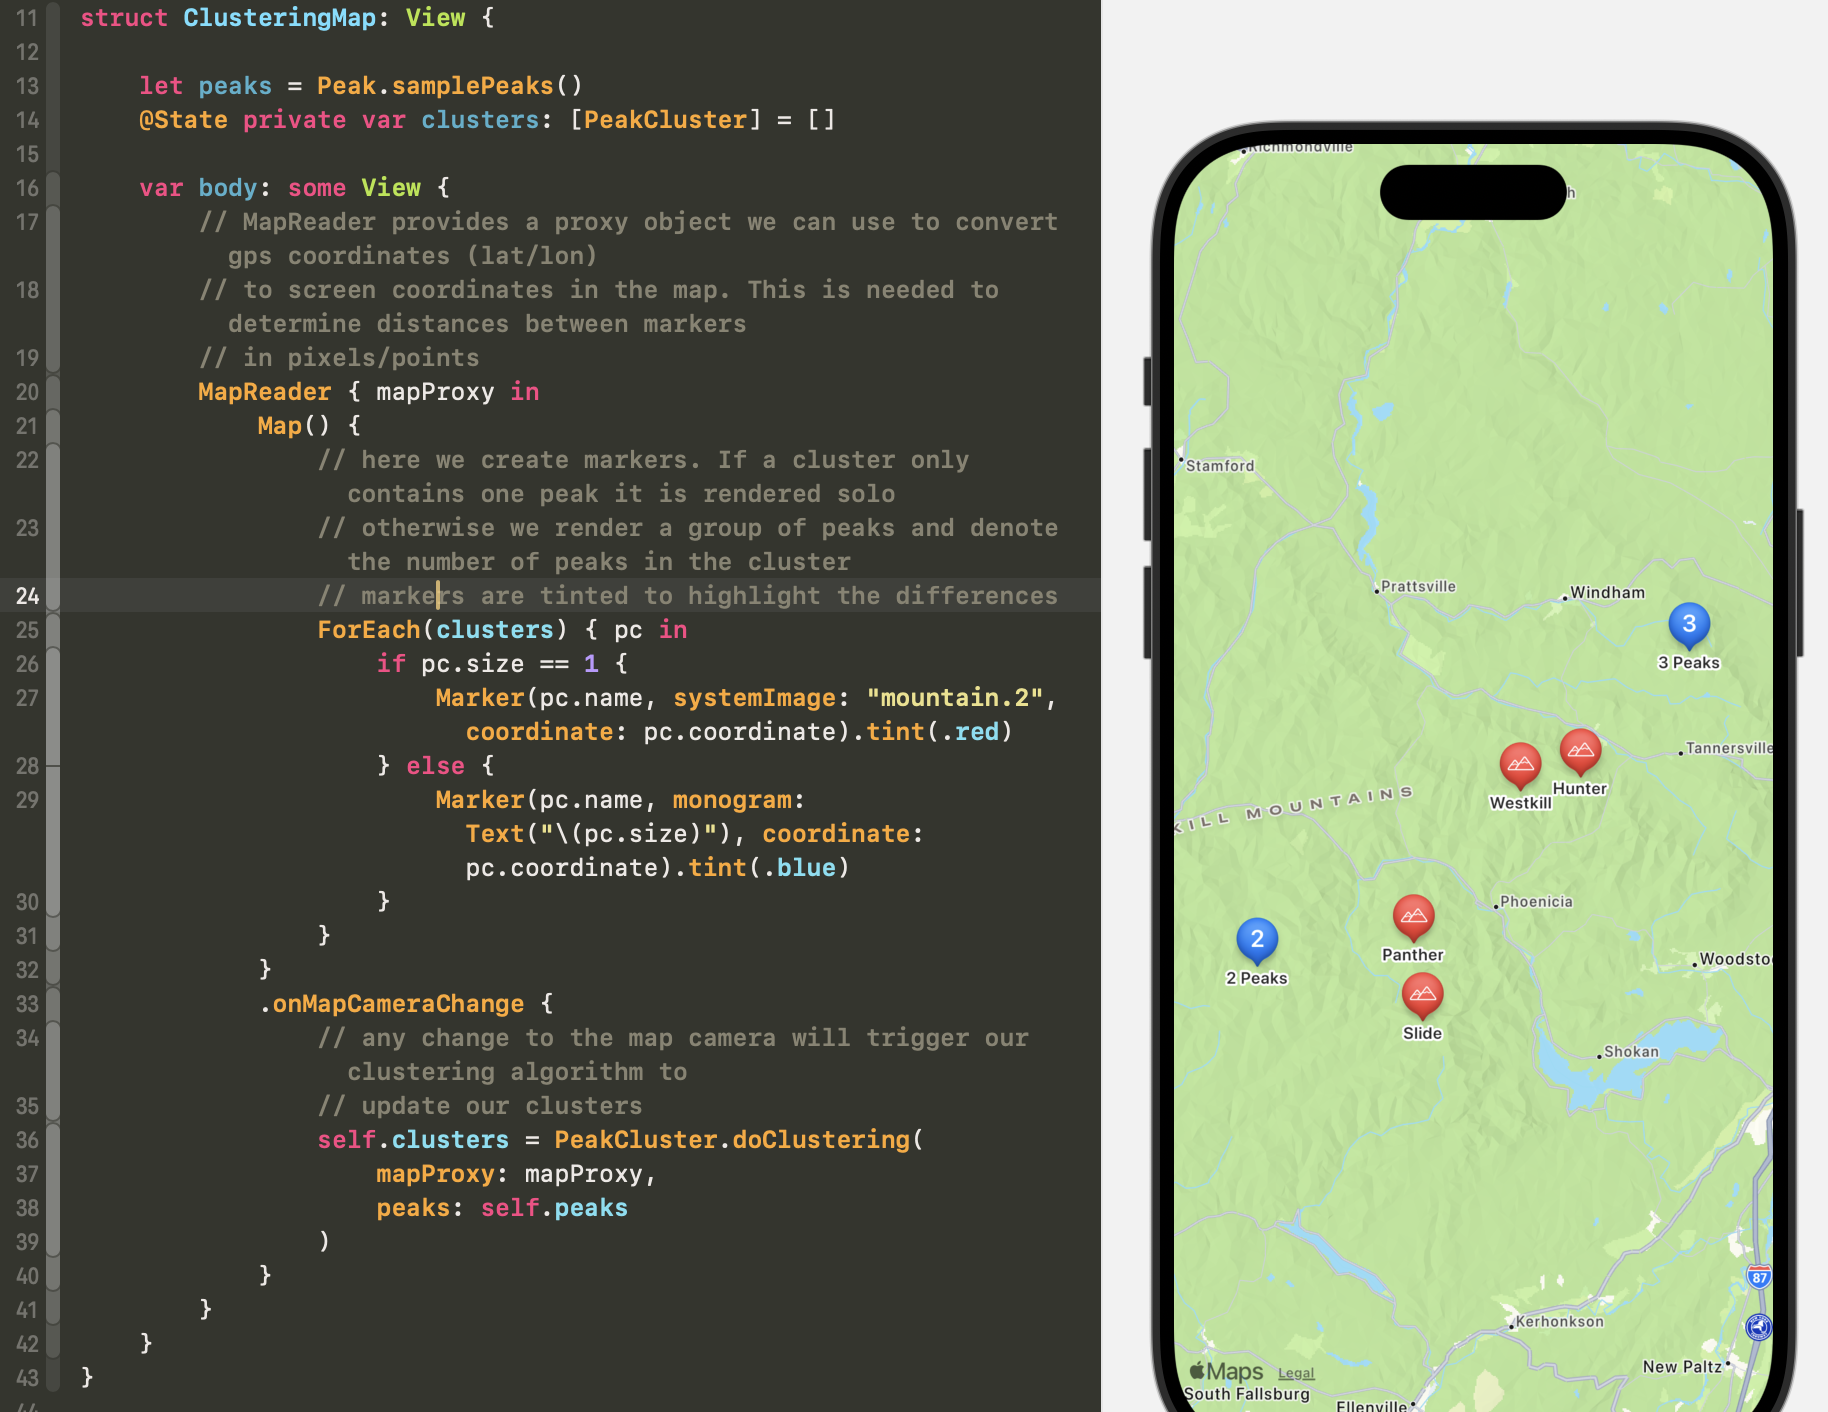
Should make sense so far but how do we determine which peak markers would overlap. As I mentioned in the intro above, it’s not just a matter of how far apart the peaks are in real world distances. Real world distances are rendered differently depending on how far in or out we are zoomed in the map. We will need a way to convert real world distances to map unit distances. This is where a MapReader and its provided proxy will come to our rescue. Next we will need a way to calculate these clusters as the user zooms in and out of the map. Thankfully SwiftUI makes this easy. There is a modifier on Map called .onMapCameraChange. This modifier will be invoked any time the camera changes (i.e. the user pans or zooms the map.) All we need to do is call our clustering algorithm to update our clusters each time.
The implementation of this will look like this:

Notice the formerly overlapping peaks are now joined into one cluster. Clustered markers are rendered with the number of peaks in the cluster and color is used in this example to highlight the clusters.
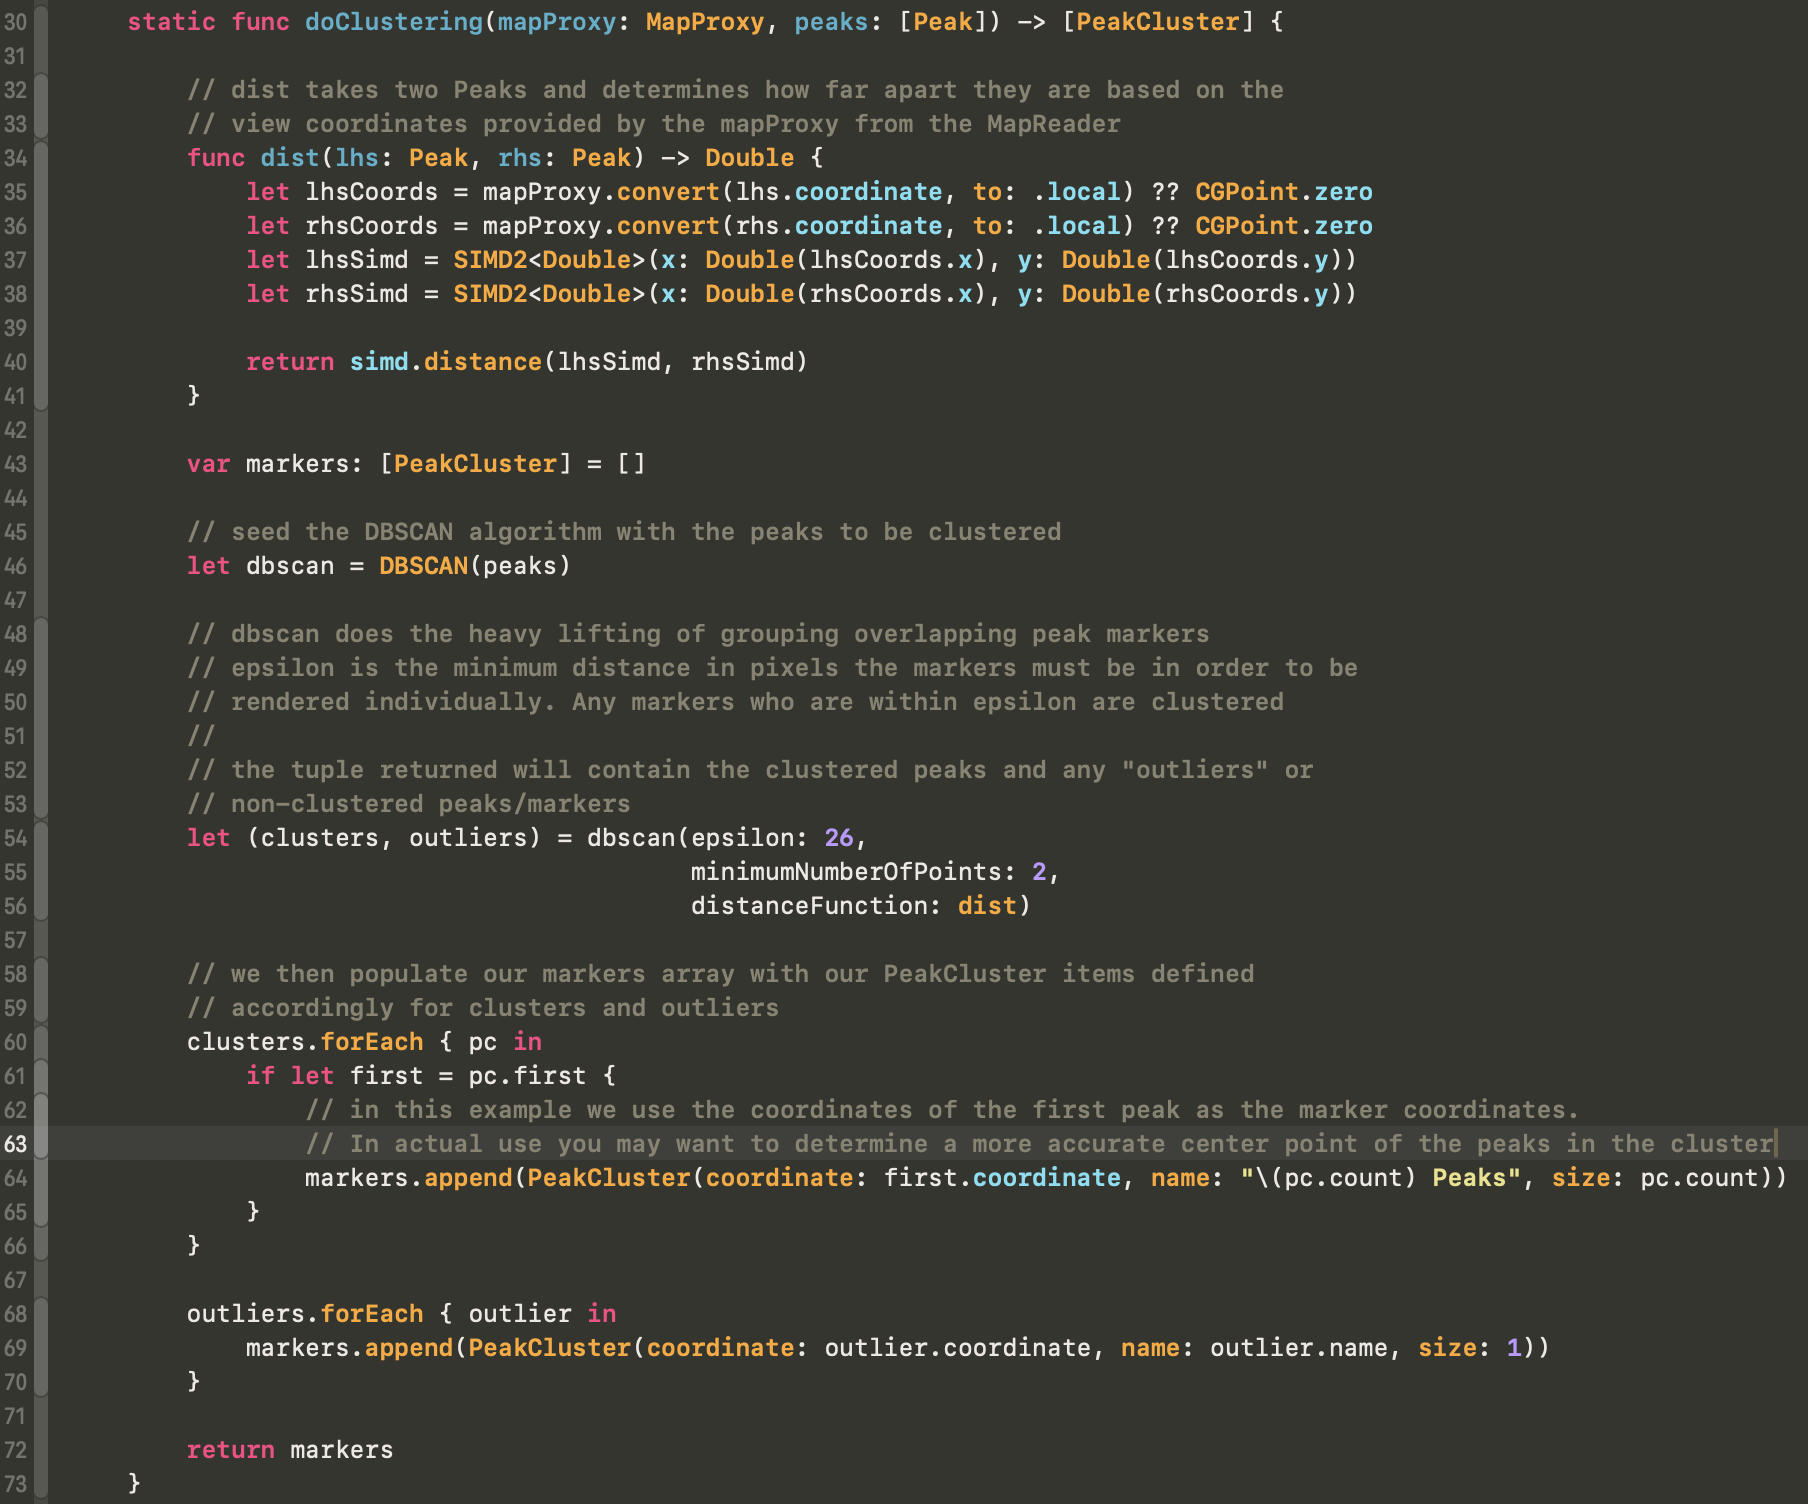
Simple, right? That “doClustering” method is doing some heavy lifting so let’s see how that magic happens.

doClustering requires two things to do it’s job. The first is the mapProxy so we can convert the peak latitude/longitude to map view units and the second thing is the actual peak items.
First we define the method to be used to determine the distance between our items. In our case the items are Peaks and they have coordinate information. Here we call into SIMD2 (for 2d point calculations, other implemetations exist for 3d, etc) This dist function will be provided to our DBSCAN function to do the clustering.
We instantiate a dbscan object with our peaks to be clustered then call its method to output the clusters and outliers. Clusters are groups of overlapping peaks and outliers are peaks that are to be rendered individually. I won’t cover how the dbscan implementation works here. Feel free to browse the code.
Then we iterate over both the clusters and the outliers creating PeakClusters for each item. In this example we just use the coordinate of the fist peak in a closter as the coordinate for the cluster. You may want to use a different method, perhaps the center of the region containing all the peaks in the cluster. For this example this simplification will work. Clusters are given a name denoting how may peaks are contained therein. The size is set to the number of peaks in the cluster. This allows us to quickly determine the marker to render back on our map.
Outliers are processed similarly. The coordinate for the outlier cluster is correctly set to the peaks coordinate as is the name and the size of one.
We then return our markers (PeakClusters) to the calling method.
This is only a very simple example to show the clustering. For an actual map app you probably need to do a bunch more. Several of the structs defined here are just barebones implementations and you might flesh out your Peak or PeakCluster objects to provide more needed data.
This implementation feels ok. It’s not perfect. It doesn’t animate the changes from cluster to unclustered markers, for example. I would love to have that but I’m not sure it’s achievable here.
One caveat is that while this code works well for iOS 18 projects, my original implementation was for iOS 17. Under iOS 17 I noticed that onMapCameraChange was called more than I would expect and in some cases the rendering of the markers before the map completed drawing would cause an infinite loop of redrawing the map. I was able to work around that with some hacks to check if I really wanted to be redrawing the map at those times. It was not an ideal solution and with iOS 18 things seem improved to the point that outside the math/algorithms to do the clustering the View code is pretty concise.